X-ray Counterparts to Stellar MeerKAT Galactic-Plane Radio Sources
Overview
X-ray Counterparts to Stellar MeerKAT Galactic-Plane Radio Sources
Multi-survey catalog cross-matching · statistical validation · astrophysical scaling-law fitting
Published in Astronomy & Astrophysics, Vol. 707, A193 (2026) · Read the paper (open access) · DOI: 10.1051/0004-6361/202556983
Overview
This is a follow-up to the SMGPS stellar-counterpart project: having identified 629 candidate stars as optical counterparts to MeerKAT radio sources, this paper cross-matches those stars against two soft X-ray survey catalogs — ROSAT (RASS) and eROSITA (eRASS1) — to test whether their radio and X-ray emission follows the Güdel–Benz relation (GBR), a well-established scaling law linking coronal X-ray output to non-thermal radio emission in magnetically active stars.
Method: cross-matching against two X-ray catalogs
Using the Gaia identifiers of the 629 SMGPS stellar candidates, the X-ray content of RASS and eRASS1 was searched via the CDS VizieR database, using a 3-arcsecond matching radius. A Monte Carlo simulation (randomizing X-ray source positions in Galactic longitude) estimated the contamination rate from chance alignment: ~6 expected false positives out of 131 eRASS1 matches, and ~2 out of 47 RASS matches — about 5% for both, confirmed as negligible.
Result: 137 stars with confirmed radio, optical, and X-ray detections — 47 from RASS, 131 from eRASS1, with 41 sources detected in both.
Figure 1 — Sky positions of all matched sources in Galactic coordinates

Figure 2 — Positional offsets between SMGPS and X-ray detections

Cross-validating the two X-ray surveys
Where RASS and eRASS1 overlap (41 common sources), their measured X-ray fluxes correlated strongly (Pearson r = 0.905), with most sources clustering within a factor of two of the 1:1 relation — evidence that flux differences are mostly instrumental/calibration effects rather than intrinsic stellar variability.
Figure 3 — RASS vs. eRASS1 flux comparison for the 41 common detections

Stellar population and color-magnitude diagram
Cross-matching all 137 sources against SIMBAD revealed a diverse population spanning main-sequence, pre-main-sequence, and evolved stars, dominated by K- and M-type young stellar objects, with a handful of interacting binaries (RS CVn, eclipsing, spectroscopic).
Figure 4 — Gaia color-magnitude diagram of the 137 radio/X-ray-emitting stars, classified by stellar population

Distinguishing coherent from incoherent radio emission
A radio-brightness temperature (TB) was computed for every star. TB separates coherent from incoherent emission at a threshold of 10¹² K. Nearly the whole sample fell below that threshold — consistent with incoherent gyrosynchrotron emission — with two clear outliers: AX J1600.9–5142 (Apep), a colliding-wind Wolf-Rayet binary, at (4.8 ± 1.5) × 10¹² K (coherent regime), and HD 124831, a G3V binary, at the unusually low end at (8 ± 1) × 10⁶ K.
Figure 5 — Radio-brightness temperature vs. Gaia color, by stellar type

Testing the Güdel–Benz relation
Radio and X-ray luminosities were compared against the canonical GBR fit from Williams et al. (2014). Both fitted power-law slopes came out close to the canonical exponent of 0.73 (RASS: 0.8 ± 0.1, Kendall's τ = 0.576; eRASS1: 0.68 ± 0.04, τ = 0.626) — the underlying scaling holds — but the sample sits systematically below the canonical normalization, i.e. stars appear over-luminous in radio relative to X-rays compared to earlier studies at higher frequencies (5–9 GHz vs. this survey's 1.3 GHz).
Figure 6 — Full radio/X-ray luminosity comparison against literature GBR samples

Figure 7 — Fitted power laws for RASS (left) and eRASS1 (right) separately
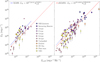
The likely explanation is a sensitivity effect: at 1.3 GHz, only the most radio-active/flaring stars clear the detection threshold, which selectively boosts the radio side of the ratio for stars that do get detected — not a break in the underlying physics.
Extending to bolometric luminosity
Radio and X-ray luminosity were each fit against bolometric luminosity. Early-type (massive) stars didn't follow a consistent trend and were excluded, since their X-rays come from wind shocks rather than coronae. For the remaining late-type stars, a fit of LX = 10(4.9±1.3) · Lbol(0.76±0.04) was obtained, with most stars clustering around log(LX/Lbol) ≈ −3 — consistent with the coronal saturation limit seen in rapidly rotating, magnetically active stars.
Figure 8 — Radio luminosity vs. bolometric luminosity

Figure 9 — X-ray luminosity vs. bolometric luminosity

Figure 10 — X-ray luminosity vs. bolometric luminosity for eRASS1 stars, color-coded by log(LX/Lbol) to separate coronal from wind-driven emitters

Conclusions
The GBR appears to act as an upper envelope rather than a tight correlation for stars detected at 1.3 GHz — most sources are over-luminous in radio relative to what the canonical relation predicts, an effect attributed to the survey's detection threshold rather than new physics. Early-type stars were also found to sit systematically below the log(LX/Lbol) ≈ −3 relation typically seen for later-type, coronally active stars. Future eROSITA data releases (DR2/DR3) and the SKA are noted as the next steps for deeper, more statistically robust versions of this analysis.
Co-authored with P. J. Groot, D. A. H. Buckley, J. Robrade, A. D. Schwope, S. Freund, P. C. Schneider, and B. Stelzer.